Top Million Sites Lost 12% of Visits; 5 Platforms Now Hold 77% of Our Google Estimate
Similarweb data shared by SparkToro shows browser visits to the top million websites fell 12.2% from Q1 2022 to Q3 2026. Our pull of Google organic estimates for 198 of those domains found the median site flat, while five platforms grew from 69.7% to 77.1% of estimated traffic.
 Vibhu Dhariwal
Cofounder & CTO, Digital Gratified
- Published
- Section
- Studies
- Reading time
- 8 minutes
Ras Al Khaimah, United Arab Emirates, .
Browser visits to the world's top million websites fell 12.2% between the first quarter of 2022 and the third quarter of 2026, according to Similarweb panel data that SparkToro co-founder Rand Fishkin published on 10 November. The study looked at all traffic, not search alone. To isolate the search channel, we pulled monthly Google organic traffic estimates for a banded sample of 300 domains from the same top-million universe. Across the 198 domains with continuous data, the median site's estimated Google organic traffic was flat over the same period (+0.2%). But five platforms grew from 69.7% to 77.1% of all the estimated traffic in the sample.
Key findings
- The Similarweb data shows top-million visits peaking at 2.243 trillion in Q1 2022, falling to a low of 1.914 trillion in Q1 2026 (down 14.7%) and recovering slightly to 1.970 trillion in Q3 2026 (down 12.2% from the peak).
- Visits per internet user fell 29.2% in the study, because the estimated number of internet users rose from 4.95 billion to 6.15 billion while visits shrank.
- In our Google organic pull, 99 of the 198 domains grew between Q1 2022 and Q3 2026 and 99 did not. The median change was +0.2%.
- Wikipedia, Google, Instagram, YouTube and Facebook took 77.1% of the sample's estimated Google organic traffic in Q3 2026, up from 69.7% in Q1 2022.
- Medians split by rank. The median site ranked 101 to 10,000 lost between 12% and 15% of its estimated organic traffic. The median site ranked beyond 10,000 gained about 40%, a result that likely reflects survivorship in our sample (see Limitations).
What the Similarweb data says
Fishkin's post groups the top million domains into five rank bands: the top 10, ranks 11 to 100, 101 to 5,000, 5,001 to 100,000, and 100,001 to 1,000,000. The headline result is the 12.2% decline in total browser visits from the Q1 2022 peak. The post also describes a "slight uptick" of roughly 3% in the traffic going to the top 100 sites relative to the rest. It does not say whether that figure is in percentage points.
The study comes with caveats that matter for search teams. Similarweb's panel sees web traffic in desktop and mobile browsers but not inside apps, so time moving into apps shows up as a decline. The data is worldwide, so a fall in one region can be masked by growth in another. And the per-user figures depend on DataReportal's internet user estimates, which are themselves modelled. The post also gives the total decline as about 10% in one passage and 12.2% in another, and its URL still carries a 24% figure from an earlier version.
The study does not split traffic by channel, so a 12% fall could come from search, social, direct or referral visits.
What our Google organic pull found
We drew a sample from the current Tranco research ranking of the top million domains: all of the top 100, plus 50 random domains from each of four lower bands. For each domain we pulled monthly estimated Google organic traffic from January 2022 to October 2026. Many top-ranked domains are infrastructure (CDNs, DNS and API hosts) with no organic search presence, so 198 of the 300 domains had data in every month and form the analysis set.
| Tranco rank band | Domains | Share of sample estimate, Q1 2022 | Share, Q3 2026 | Median change | Domains that grew |
|---|---|---|---|---|---|
| 1 to 100 | 68 | 94.43% | 94.41% | -1.9% | 33 of 68 |
| 101 to 1,000 | 32 | 4.65% | 5.21% | -14.7% | 11 of 32 |
| 1,001 to 10,000 | 38 | 0.89% | 0.36% | -11.9% | 18 of 38 |
| 10,001 to 100,000 | 32 | 0.02% | 0.02% | +37.5% | 20 of 32 |
| 100,001 to 1,000,000 | 28 | under 0.01% | under 0.01% | +42.6% | 17 of 28 |
| All | 198 | 100% | 100% | +0.2% | 99 of 198 |
Median change compares each domain's average monthly estimate in Q3 2026 with Q1 2022. Shares are of the summed estimate across the 198 domains.
Two patterns stand out. First, the top 100's share of the sample barely moved, from 94.43% to 94.41%. That echoes the Similarweb finding that the biggest sites held their ground while total traffic fell. Second, the concentration happened inside the top 100, not between bands. The five largest platforms took a larger slice even though the median top-100 domain was slightly down. Instagram's estimate more than tripled over the period, while Google's own domain rose by about 17%. Taking out those five platforms, the summed estimate of the remaining 193 domains rose by 10%.
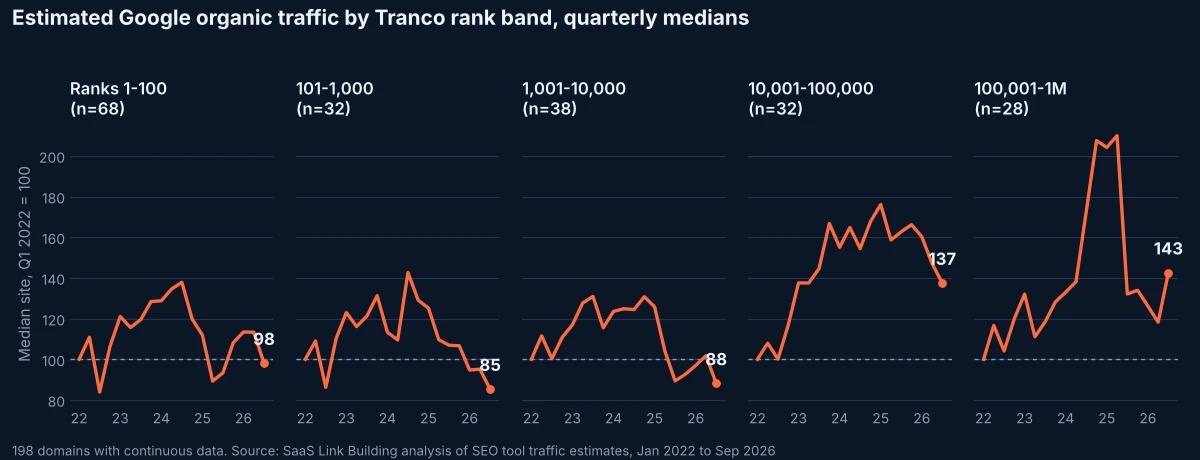
The timeline adds a detail the start and end points hide. In the top 100 band, the median domain's yearly average estimate peaked in 2024 at 132.5 (Q1 2022 = 100) and fell back to 105.2 for January to October 2026. For ranks 101 to 1,000 the peak came in 2023 at 131.5, and the 2026 figure is 90.6. In other words, the mid-ranked sites did not decline steadily from 2022. They grew, then gave the gains back over roughly the last two years. That fits with the period in which AI answers spread across Google results, but our data cannot show cause. Treat that link as speculation.
How this squares with Google's position
Google has argued that clicks from Search are holding up. In an August 2025 post, Google's head of Search, Liz Reid, wrote that total organic click volume from Search to websites had been "relatively stable year-over-year" (Google blog). Google has not published click figures by site size.
Our median result is consistent with "relatively stable" for the typical site in this sample. The concentration figure tells a different story about where the stable volume goes: more of it is landing on a handful of platforms. We found a related pattern in October when we tested whether Google favours big brands and found YouTube and Reddit winning instead. Our check on Google's promise to small sites found that small sites' share of the SERPs we tested had grown since 2024, so the picture differs by query set.
For publishers specifically, the decline looks steeper. Chartbeat data we covered in October put search at 12% of North American publisher pageviews in Q3 2026, down from 21% (our report).
Limitations
- Survivorship. The Tranco list was generated on 14 November 2026. A domain ranked 500,000th today had to survive and grow to get on the list, which biases the lower bands towards winners. The gains of about 40% in those bands should not be read as small sites doing well in general.
- Modelled data. Organic traffic estimates multiply search volume by an assumed click-through rate for each ranking keyword. They are not measured clicks and do not reflect AI Overviews or other SERP features that take clicks.
- Provider changes. The median number of Google results each domain appeared in fell 55.4% over the period, across every band. That uniform drop suggests a change in the underlying keyword database rather than real ranking losses. Comparisons within the sample (medians and shares) are more reliable than absolute totals.
- Sample size. Bands outside the top 100 have 28 to 38 domains each, so their medians can swing with a few sites.
What this means for SEO teams
- Benchmark against the median, not the market total. A 12% fall in global visits says little about one site's search traffic. In our sample, the typical site's Google estimate was flat, and half grew.
- Check where your queries now land. If Instagram, YouTube, Wikipedia or Facebook pages rank for your main terms, part of the demand may be going there. Track the share of page-one results those platforms hold for your keyword set each quarter.
- Compare against your peak year, not 2022. For ranks 101 to 10,000, the median estimate peaked in 2023 and has fallen since. Compare your organic sessions in analytics from 2023 onwards before you draw conclusions from a 2022 baseline, since Search Console shows only the last 16 months.
Methodology
On 15 November 2026 we downloaded the Tranco top-million list with ID 947V2, generated on 14 November 2026 and aggregating five popularity rankings over 30 days. We took all domains ranked 1 to 100 and a random sample of 50 domains from each of the bands 101 to 1,000, 1,001 to 10,000, 10,001 to 100,000 and 100,001 to 1,000,000 (drawn with fixed random seeds), for 300 domains. For each domain we pulled worldwide monthly estimated Google organic traffic from January 2022 to October 2026 from an SEO data provider's historical traffic estimation endpoint. We kept the 198 domains with a non-zero estimate in all 58 months. For each domain we averaged the monthly estimates for Q1 2022 (January to March) and Q3 2026 (July to September) and computed the change. Band medians, shares of the summed estimate and the concentration figure for the five largest domains were calculated from those quarterly averages. The yearly figures in the timeline use the median of each domain's average monthly estimate for the year, indexed to its Q1 2022 average. Similarweb figures come from the SparkToro post published on 10 November 2026 and were not recalculated by us.
Conclusion
The Similarweb data says the open web lost about one in eight browser visits since early 2022. In our Google organic sample, the typical site held level and half of the sites grew. The bigger change was concentration: five platforms now account for more than three quarters of the estimated traffic, up from under 70%.
For most teams, the practical question is whether the queries they depend on have moved to one of those platforms or to an AI answer. Search Console and a quarterly SERP check can answer that for their own site.
Questions and answers
How much did visits to the top million websites fall?
According to Similarweb panel data published by SparkToro on 10 November 2026, browser visits to the top million domains peaked at 2.243 trillion in Q1 2022 and were 1.970 trillion in Q3 2026, a 12.2% decline. The low point was 1.914 trillion in Q1 2026.
Did Google organic traffic fall by the same amount?
Not in our sample. Across 198 domains with continuous data, the median domain's estimated Google organic traffic changed by +0.2% between Q1 2022 and Q3 2026, and 99 of the 198 domains grew.
Which sites gained the most share of estimated Google organic traffic?
Wikipedia, Google, Instagram, YouTube and Facebook together held 77.1% of the sample's estimated Google organic traffic in Q3 2026, up from 69.7% in Q1 2022.
Why does the Similarweb data show a bigger drop than search estimates?
The Similarweb panel counts browser visits from all channels worldwide and excludes app usage, while our figures are modelled Google organic estimates for a sample of domains. The two measure different things, and our lower-ranked bands are biased towards sites that survived onto today's top-million list.
What has Google said about clicks to websites?
In an August 2025 post, Google's head of Search Liz Reid wrote that total organic click volume from Google Search to websites had been relatively stable year over year.
More releases
-
Studies
Reddit Visits Fell 13% in October; Our Repeat Test Found It in 19 of 36 Top 10s, From 30
Reddit's global web visits fell 13% year on year in October, Similarweb data shows. Our repeat check of 36 US Google searches on 15 November found a Reddit thread in the top 10 on 19, down from 30 on 4 November, while AI Overviews kept citing Reddit at about 6%.
-
Studies
United Bars AI Agents by Contract; Only 3 of 41 Airline Robots.txt Files Name AI Bots
United Airlines restricted third-party AI agents on 11 November through its terms, not its robots.txt. Our request to 75 airline websites found that only 3 of the 41 robots.txt files we could read name any AI bot, none blocks user-initiated agents, and 34 sites returned no readable file.
-
Studies
Does Google Score Whole Sites? Trial Notes Suggest So; Page Links Won 21 of 24 SERPs
Google says it has no website authority score, yet its ranking guide cites site-wide signals and a Google engineer's trial notes call its quality score largely site-level. In our pull of 60 live searches and 24 snapshots, page-level link scores tracked rankings far better than domain scores, winning 21 of 24 head to head.
Tell us the site and the goals.
Rankings in Google and visibility in AI answers, from one monthly plan. One call is enough to say which one fits. Email works just as well.