Search Fell to 12% of North American Publisher Pageviews in Q3 2026, From 21%, Chartbeat Data Shows
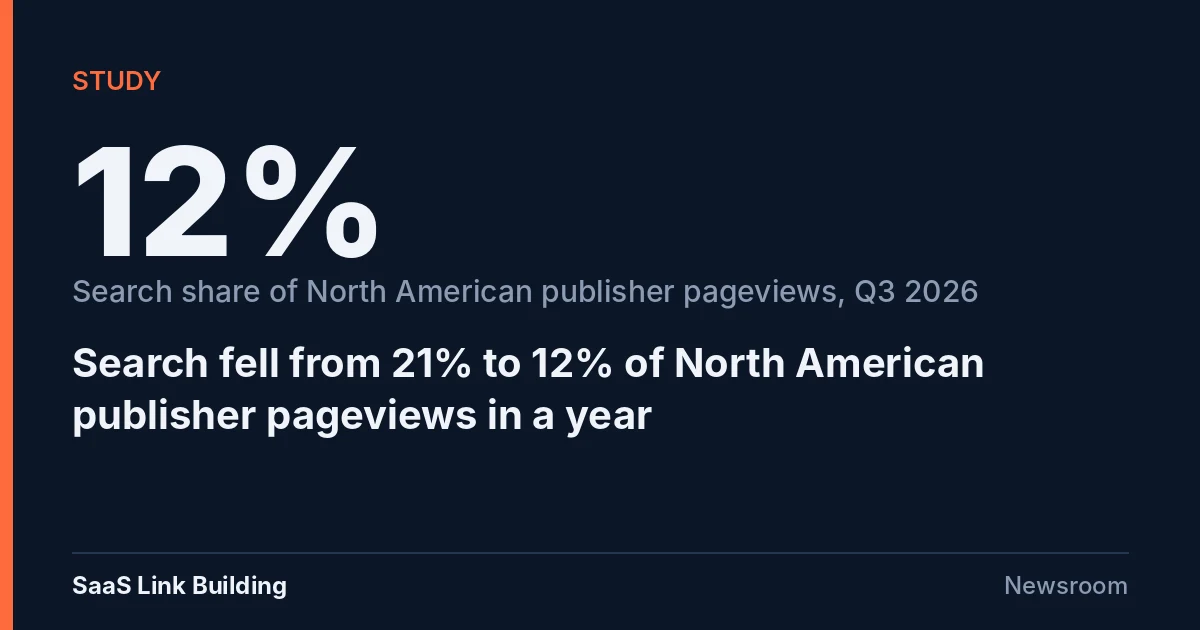
Search engines drove 12% of pageviews at North American publishers in Chartbeat's network in Q3 2026, down from 21% a year earlier. Our comparison of Chartbeat's quarterly charts finds nine of ten regions lost search share, with a median fall of 8 points, while Chartbeat says overall publisher traffic is steady.
 Vibhu Dhariwal
Cofounder & CTO, Digital Gratified
- Published
- Section
- Studies
- Reading time
- 6 minutes
Ras Al Khaimah, United Arab Emirates, .
Search engines accounted for 12% of pageviews at North American publishers in Chartbeat's network in the third quarter of 2026, down from 21% in the third quarter of 2025, according to the regional charts in Chartbeat's quarterly audience reports. Chartbeat, a content analytics company used by news publishers, published its Q3 2026 global audience insights on 15 October 2026. We compared its search chart with the same chart in the Q3 2025 report and the Q4 2025 report to measure the change across all ten regions Chartbeat tracks.
Nine of the ten regions show a lower share of pageviews from search than a year earlier. North America now has the lowest search share of any region, and the largest relative decline: a fall of nine percentage points, or 42.9% of its year-earlier share.
Key findings
- North America: 21% in Q3 2025, 16% in Q4 2025, 13% in Q2 2026 and 12% in Q3 2026.
- Nine of ten regions fell year on year. The median change across the ten regions was minus 8 points.
- Central Asia fell furthest in points, from 53% to 33%, a 20-point drop.
- Africa was the only region to rise, from 41% to 46%.
- The simple average of the ten regional shares fell from 32.4% to 25.0%. This is an unweighted average of regions, not a network-wide figure.
- Chartbeat says overall traffic is steady. The Q3 2026 report says overall traffic to publishers in its network "remains steady" while search declines.
| Region | Q3 2025 | Q4 2025 | Q2 2026 | Q3 2026 | Change, Q3 to Q3 (points) |
|---|---|---|---|---|---|
| Central Asia | 53% | 45% | 40% | 33% | -20 |
| North America | 21% | 16% | 13% | 12% | -9 |
| Middle East | 36% | 36% | 28% | 27% | -9 |
| Southeast Asia | 43% | 44% | 37% | 35% | -8 |
| Southern Europe | 33% | 29% | 26% | 25% | -8 |
| Central / Eastern Europe | 27% | 25% | 19% | 19% | -8 |
| Asia / Pacific | 24% | 22% | 19% | 17% | -7 |
| Northern Europe | 19% | 16% | 13% | 13% | -6 |
| Latin America | 27% | 26% | 23% | 23% | -4 |
| Africa | 41% | 47% | 48% | 46% | +5 |
Where the decline happened
The North American figures show the drop was steepest at the turn of the year. Five of the nine lost points came between Q3 and Q4 2025, when the share fell from 21% to 16%. It then fell a further three points by Q2 2026 and one more by Q3 2026. That pattern suggests the decline is slowing in North America, though one quarter is not enough to call a floor.
In its Q4 2025 report, Chartbeat said most regions saw decreases in pageviews from search and described this as likely a result of AI's growing impact on search. The Q3 2026 report does not give a cause. Its main finding on search is that search traffic either fell or held level in every region during the quarter.
Chartbeat's text and its chart do not match exactly for North America. The text lists North America among regions where search traffic did not change from Q2 to Q3 2026, while the chart shows 13% falling to 12%. The gap may be rounding; Chartbeat does not publish the underlying decimals. For Central Asia, the text and chart agree: a seven-point fall from 40% to 33% quarter on quarter.
Context
The figures describe the share of pageviews, not the number of visits. A falling search share can come from fewer search visits, from growth in other sources, or both. Chartbeat's statement that overall traffic is steady means the share figures alone cannot tell readers how many search visits were lost.
Chartbeat also groups all search engines into a single category in these charts, so the figures cover Google, Bing and other engines together. Google's own Search Status Dashboard shows that the period covered includes two confirmed core updates in 2026 (March and May) and several spam updates, as we set out in our 2026 ranking update calendar. Google has not linked any of those updates to publisher traffic share, and Chartbeat does not attribute the Q3 decline to any specific Google change.
The data fits other recent signs of shifting referral patterns. On 22 October we covered a study of 100 GA4 properties that found ChatGPT sent 0.62% as many sessions as Google organic, which suggests AI assistants are not yet replacing the lost search share at the same volume. For publishers who depend on Google's feeds, our report on how Discover filters stale stories covers one of the other channels Chartbeat's search category may or may not include.
What this means for SEO teams
- Benchmark share and volume separately. Track search sessions as a count as well as a share of traffic, so a growing newsletter or social channel does not read as a search loss, and vice versa.
- Compare by region. The spread runs from 12% in North America to 46% in Africa. Publishers with international audiences should set regional baselines rather than a single target.
- Check the Q4 window. North America lost five points between Q3 and Q4 2025. Pull your own Search Console data for October to December 2025 to see whether your site followed the same step change.
- Invest in direct and loyal audiences. Chartbeat links steady overall traffic to audiences continuing to trust their preferred sources. Sign-ups, apps and newsletters reduce exposure to any single referrer.
- Treat these as network averages. The figures describe publishers in Chartbeat's network, and Chartbeat does not publish its make-up. B2B and SaaS sites should test the trend against their own data before changing plans.
Methodology
On 24 October 2026 we downloaded the search chart images from three Chartbeat quarterly reports: Q3 2025 (published 3 October 2025), Q4 2025 (published 14 January 2026) and Q3 2026 (published 15 October 2026). Each chart shows the "percentage of all pageviews coming from search engines" for ten regions, with the current and previous quarter side by side. We read the labelled percentage for each region and quarter directly from the charts. The Q2 2026 values come from the previous-quarter bars in the Q3 2026 chart. We did not use the Q1 or Q2 2026 reports.
Changes are simple differences in percentage points. Relative changes divide the point change by the Q3 2025 value. The ten-region average and median are unweighted and give each region equal weight regardless of traffic. Chartbeat does not state the number of sites in its network, whether the same sites are included each quarter, or how it defines each region, so the figures may reflect changes in the panel as well as changes in behaviour.
Conclusion
Chartbeat's own charts show search losing share of publisher pageviews in nine of ten regions over the past year, with North America falling from 21% to 12% and now the lowest of any region. Most of that North American drop happened in late 2025, and the decline has slowed since.
Because Chartbeat reports overall traffic as steady and does not disclose its panel, the data shows a change in the mix of where publisher readers come from, not a measured count of lost search visits.
Questions and answers
What share of publisher pageviews came from search in North America in Q3 2026?
12%, according to the search chart in Chartbeat's Q3 2026 global audience insights report, published 15 October 2026. The Q3 2025 report showed 21%.
Did every region lose search share?
No. Nine of the ten regions in Chartbeat's charts had a lower search share in Q3 2026 than in Q3 2025. Africa rose from 41% to 46%.
Which region had the largest fall?
Central Asia fell the most in percentage points, from 53% to 33%. North America had the largest relative fall, losing 42.9% of its year-earlier share.
Does a lower search share mean fewer search visits?
Not necessarily. The figures are shares of pageviews. Chartbeat says overall traffic to publishers in its network remains steady, and it does not publish visit counts or the size of its network.
More releases
-
Explainers
Chrome 155 Decodes JPEG XL, but Google Images and Discover Still Don't Support It, Google's Mueller Says
Google Images and Discover do not support JPEG XL, Google's John Mueller said on 15 October, even though Chrome 155, stable since 6 October, now decodes the format. Google's documentation lists seven supported image formats. Serving JPEG XL inside a picture element with a supported img fallback keeps images eligible.
-
Industry news
Meta Delays Its Website Crawling Terms 3 Weeks to 20 November as Publishers in 120 Countries Object
Meta has pushed the start of its updated Commercial Terms, which let it crawl websites of businesses that use its products, from 30 October to 20 November 2026. WAN-IFRA, representing more than 20,000 media brands, confirmed the delay on 23 October but says it does not address publishers' concerns about the clause.
-
Updates
Google Updates 2 Help Pages on 23 October: Hyphens Over Underscores in URLs, Percent-Encoding in Robots.txt
Google revised two core help pages on 23 October 2026. Its URL structure guide now explains why hyphens beat underscores as word separators, and its robots.txt specification now recommends percent-encoding non-ASCII rule paths. The matching rules themselves are unchanged; Google says both edits sync the docs with its Non-Canonical Cabinet videos.
Tell us the site and the goals.
Rankings in Google and visibility in AI answers, from one monthly plan. One call is enough to say which one fits. Email works just as well.