Running a SaaS business is exciting, but it can also be tricky. There is so much happening—customer signups, cancellations, upgrades, revenue, churn, and more. You need to keep track of everything if you want to grow. But how do you know what to focus on?
That is where SaaS metrics come in.
Think of them like a compass. They help you understand where your business is going and what you need to do to get there faster. Without them, you are just guessing.
This blog will break down all the essential SaaS metrics you need to know in 2025. Whether you are just starting or already running a growing SaaS, these numbers will help you make better decisions.
Let us dive in.
Why SaaS Metrics Matter for Growth?
You might wonder—do these numbers really make a difference?
Yes, they do. Without tracking your SaaS metrics, you are working in the dark. You will not know what is working, what needs fixing, or where your growth is coming from.
Here is why these metrics matter:
- Spot problems early – A rising churn rate? Slowing user growth? You will catch it early.
- Make smarter decisions – Metrics give you real data, not guesses or gut feelings.
- Plan better – Know how much to invest in marketing, product development, or hiring.
- Improve customer experience – Metrics like NPS, support response time, and usage patterns tell you what your users love or hate.
- Attract investors – Investors look at these numbers to decide if your business is worth funding.
Tracking the right metrics keeps your business healthy and moving in the right direction.
How to Calculate Key SaaS Metrics?
Now that you know why SaaS metrics are important, let us talk about how to calculate them.
Most of these metrics are not hard to figure out once you understand the basic formulas. Some need just simple division, while others combine a few numbers. But do not worry—we will keep everything easy to follow.
Here is what you will usually need:
- Number of customers
- Subscription prices
- Revenue earned
- Costs spent
- Customer activity (logins, upgrades, cancellations)
Each metric we explain in this blog will come with a clear formula, a simple example, and a quick note on why it matters.
Top SaaS Metrics to Track for Growth in 2025
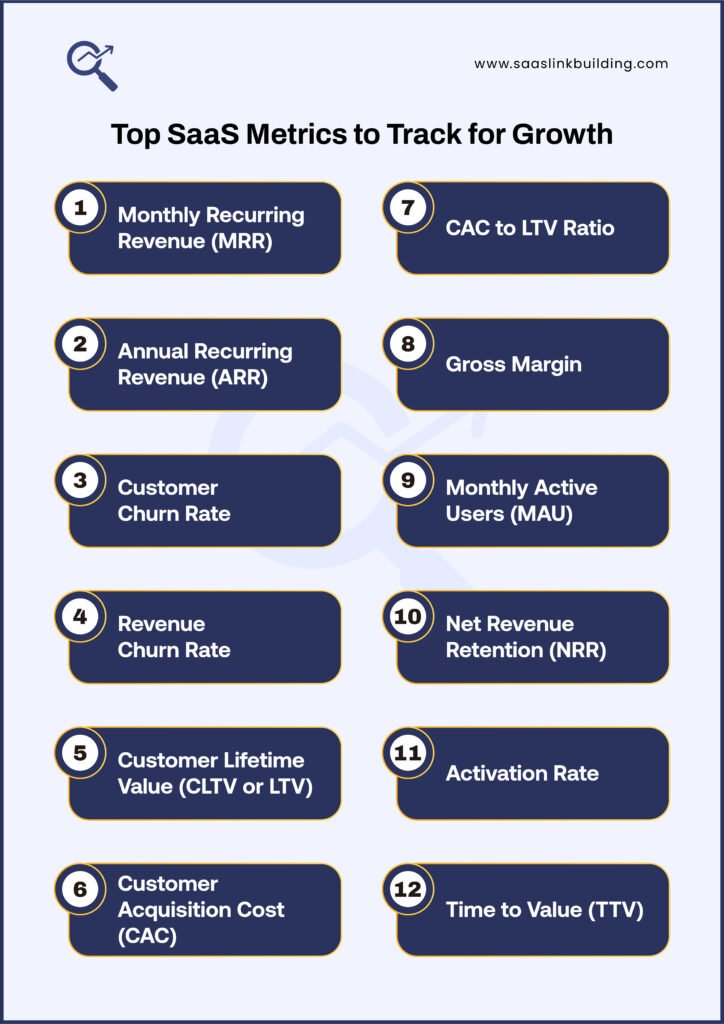
Here are some of the most important metrics every SaaS business should watch:
1. Monthly Recurring Revenue (MRR)
What is MRR?
MRR is the total money you earn every month from your active subscriptions.
If someone pays you 50 dollars every month, that adds 50 dollars to your MRR.
Simple, right?
Why MRR Matters
- Shows steady income
- Helps with monthly planning
- Easy to track growth
How to Calculate It
MRR = Monthly subscription price × Number of active customers
Example: If 100 people pay you 30 dollars a month, your MRR is 3000 dollars.
2. Annual Recurring Revenue (ARR)
What is ARR?
ARR is your recurring revenue on a yearly basis. It is like MRR, but for the whole year.
Why ARR Matters
- Good for long-term planning
- Helps investors see yearly revenue
- Gives a big-picture view
How to Calculate It
ARR = MRR × 12
If your MRR is 10,000 dollars, then ARR is 120,000 dollars.
3. Customer Churn Rate
What is Churn?
Churn is when a customer stops using your service or cancels their subscription.
Why Churn Matters
If you lose too many customers, your business will shrink—even if you are gaining new ones.
How to Calculate It
Churn Rate = (Customers lost during a period ÷ Total customers at the start of the period) × 100
Example: If you had 1000 customers and lost 50 in a month, your churn rate is 5%.
4. Revenue Churn Rate
What is Revenue Churn?
It is the percentage of revenue you lose from existing customers in a certain period.
This is different from customer churn because some big customers pay more than others.
Why It Matters
- Tells you how much money you are losing
- Shows if high-paying customers are leaving
Formula
Revenue Churn = (MRR lost ÷ MRR at the start) × 100
5. Customer Lifetime Value (CLTV or LTV)
What is LTV?
This is the total money you expect to earn from a customer during their time with you.
Why It Matters
- Helps decide how much to spend on acquiring customers
- Shows the value of your user base
Formula
LTV = Average revenue per user × Customer lifespan
Example: If someone pays 50 dollars a month and stays for 12 months, LTV is 600 dollars.
6. Customer Acquisition Cost (CAC)
What is CAC?
It is the cost of getting a new customer. Includes marketing, sales, tools, salaries—everything.
Why CAC Matters
- Tells if your marketing is working
- Helps balance your budget
Formula
CAC = Total cost of sales and marketing ÷ Number of new customers
Example: If you spent 2000 dollars and got 10 new customers, CAC is 200 dollars.
7. CAC to LTV Ratio
This shows how much profit you make from a customer compared to the cost of getting them.
Ideal Ratio
A healthy CAC to LTV ratio is around 1:3.
This means for every 1 dollar you spend to acquire a customer, you make 3 dollars.
8. Gross Margin
What is Gross Margin?
It is the money you keep after paying the direct costs to run your service.
Why It Matters
- Shows how efficient your business is
- Affects profitability
Formula
Gross Margin = (Revenue – Cost of goods sold) ÷ Revenue × 100
Higher gross margin is better.
9. Monthly Active Users (MAU)
What is MAU?
It tells how many unique users used your product at least once in a month.
Why MAU Matters
- Shows engagement
- Helps measure product value
- Useful for free or freemium models
You can also track DAU (Daily Active Users) to get a more detailed view.
10. Net Revenue Retention (NRR)
What is NRR?
It tells how much revenue you keep from existing customers, including upgrades, downgrades, and churn.
Why It Matters
- Tells if current users are growing with your product
- Shows product stickiness
Formula
NRR = (Starting MRR + Expansion – Churn – Contractions) ÷ Starting MRR × 100
If your NRR is over 100%, that is great. It means your revenue is growing even without new customers.
11. Activation Rate
What is Activation Rate?
It is when a user does something meaningful for the first time. Like setting up an account or creating a project.
Why It Matters
- Helps measure onboarding success
- Shows if people understand your product quickly
Improving activation can lower churn and boost retention.
12. Time to Value (TTV)
What is TTV?
This measures how long it takes for a new user to get value from your product.
Why It Matters
- Shorter TTV = better user experience
- Faster TTV = lower churn
You want users to see value as quickly as possible.

13. Expansion MRR
What is Expansion MRR?
It is the extra revenue you earn from current customers through upgrades, add-ons, or cross-selling.
Why It Matters
- Helps grow without getting new users
- Shows how much customers love your product
14. Product Stickiness
What is Product Stickiness?
It shows how often users come back to your product.
Formula
Stickiness = DAU ÷ MAU × 100
The higher, the better. A stickiness rate above 20% is usually good.
15. Burn Rate
What is Burn Rate?
This is how fast your business is spending money each month.
Why It Matters
- Shows if you are running out of cash
- Helps with budgeting
There are two types:
- Gross Burn: Total money spent
- Net Burn: Money lost after revenue
16. Runway
What is Runway?
It is how many months you can keep running at your current burn rate before your money runs out.
Formula
Runway = Cash in hand ÷ Net burn rate
If you have 100,000 dollars and burn 10,000 dollars a month, your runway is 10 months.
17. Trial to Paid Conversion Rate
What is it?
It shows how many people who started a free trial ended up becoming paying customers.
Why It Matters
- Helps improve onboarding
- Shows product-market fit
Improving this can make a huge impact on revenue.
18. Feature Adoption Rate
What is It?
It tells you how many users are using a particular feature.
Why It Matters
- Tells if new features are useful
- Helps product team focus on the right things
You can also find which features drive the most engagement.
19. Support Ticket Volume
What is It?
It tells how many customer issues are being raised.
Why It Matters
- Helps improve customer experience
- Shows if users are confused or stuck
Fewer support tickets usually mean a smoother product.
20. First Response Time
What is It?
It tells how fast your support team replies to customer questions.
Why It Matters
- Fast responses build trust
- Keeps customers happy
People hate waiting, especially when they are stuck.
21. Net Promoter Score (NPS)
What is NPS?
It is a simple way to measure customer satisfaction. You ask customers:
“How likely are you to recommend us to a friend?”
They answer from 0 to 10.
- 9–10 = Promoters
- 7–8 = Neutral
- 0–6 = Detractors
Formula
NPS = % Promoters – % Detractors
A good NPS is usually above 30.
22. Customer Retention Rate
What is it?
It tells how many customers stayed with you over a period of time.
Formula
Retention Rate = (Customers at end – New customers) ÷ Customers at start × 100
Higher retention = healthier business.
23. ARPU (Average Revenue Per User)
What is ARPU?
It tells how much revenue you make per user.
Formula
ARPU = Total MRR ÷ Number of active users
If your ARPU is low, try upselling or adjusting pricing.
24. Customer Health Score
This is a score that shows how happy or at-risk a customer is.
You can build it using:
- Login frequency
- Product usage
- Support tickets
- NPS score
Helps your team take action before a customer churns.
25. Quick Ratio
What is Quick Ratio?
It shows how fast your SaaS is growing.
Formula
Quick Ratio = (New MRR + Expansion MRR) ÷ (Churned MRR + Contraction MRR)
If your ratio is over 4, you are growing fast.
Tools to Track and Analyze SaaS Metrics
You can track your SaaS metrics manually in a spreadsheet, but as your business grows, that gets tough to manage. That is where SaaS analytics tools can really help. These tools collect data, calculate your metrics automatically, and show them in easy-to-read dashboards.
Here are some popular tools you can use:
1. ChartMogul
- Tracks MRR, ARR, churn, LTV, and more
- Connects with Stripe, PayPal, and other billing systems
- Great visual reports for teams and investors
2. Baremetrics
- Real-time insights into revenue, churn, upgrades, and downgrades
- Offers customer profiles and forecasting features
- Clean and simple dashboard
3. ProfitWell
- Free tool for core SaaS metrics
- Includes retention analysis and benchmarks
- Helps reduce churn with actionable tips
4. Mixpanel
- Focuses more on user behavior and product usage
- Great for tracking feature adoption and activation rates
- Helps improve user experience
5. Google Analytics
- Not SaaS-specific but helpful for tracking site traffic and conversion rates
- Can show how users move through your signup or onboarding flow
6. HubSpot or Salesforce (for CRM + Revenue Tracking)
- Combine sales pipeline data with customer metrics
- Useful if your sales process is complex
How to Use SaaS Metrics to Improve Decision-Making?
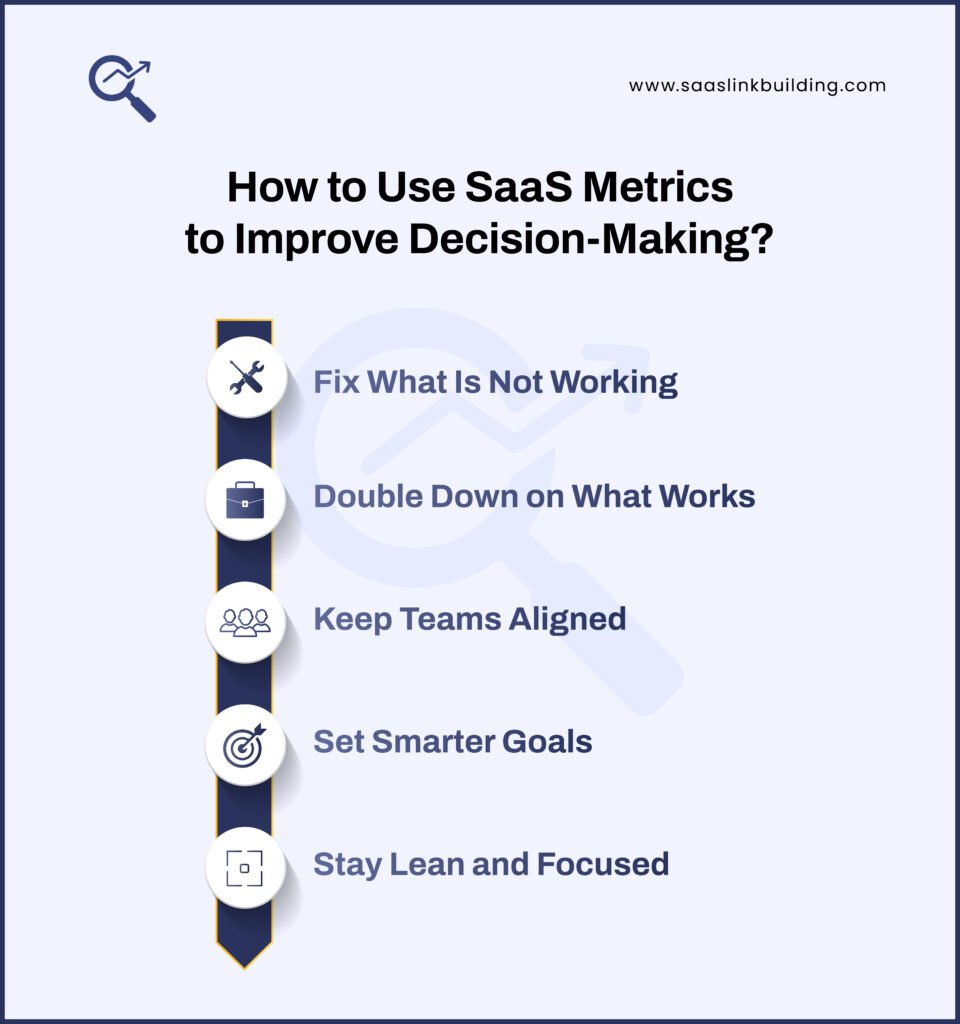
Knowing your SaaS metrics is good. But using them to make better decisions? That is where the magic happens.
Here is how you can actually use these numbers to grow your business:
1. Fix What Is Not Working
- High churn? Improve your onboarding or support.
- Low conversion from trial to paid? Rethink your trial experience.
- Low LTV? Add upsells or improve retention.
2. Double Down on What Works
- See high engagement with a specific feature? Make it even better.
- One marketing channel brings most of your paying users? Invest more there.
- Expansion MRR going up? Focus on account growth strategies.
3. Set Smarter Goals
- Use your metrics to create real, measurable goals.
- Example: Increase NRR to 110% in 6 months or reduce CAC by 20%.
4. Stay Lean and Focused
- Track burn rate and runway to avoid overspending.
- Focus on the features that drive retention, not just new ideas.
5. Keep Teams Aligned
- Share metric dashboards with your team.
- Align product, marketing, support, and sales on the same goals.
Looking to turn insights into impact?
Tracking the right SaaS metrics is powerful—but combining them with a smart marketing strategy is how you really grow. Metrics show what is working. Marketing helps scale it.👉 Check out our complete SaaS marketing guide to learn how to attract, engage, and convert more users—backed by real numbers.
Common Mistakes When Tracking SaaS Metrics
Tracking SaaS metrics is powerful—but only if you do it right. Many businesses collect data but still make poor decisions because they are tracking the wrong way.
Here are some common mistakes to avoid:
1. Tracking Too Many Metrics
- More data is not always better.
- Focus on metrics that actually guide decisions. The rest is noise.
2. Ignoring Churn and Retention
- It is easy to get excited about growth and MRR.
- But if churn is high, growth will not last.
3. Using Vanity Metrics
- Metrics like total signups or social followers might look good but do not always mean business success.
- Stick to metrics tied to revenue, engagement, and customer success.
4. Not Segmenting Data
- Different customers behave differently.
- Segment by plan, region, source, or behavior to see what really drives results.
5. Relying on Outdated Data
- Make sure your tools are syncing regularly.
- Real-time or recent data leads to better, faster decisions.
6. Forgetting About Context
- Metrics need meaning.
- A 5% churn rate might be okay for one business and a disaster for another.
Final Words
That was a big list—but an important one.
You do not need to track every metric from day one. But the more your SaaS grows, the more these numbers matter.
Start small:
- Track MRR, CAC, and churn.
- Then add LTV, NPS, and expansion MRR.
- As you scale, keep an eye on your runway, burn rate, and support metrics.
Use these numbers to guide your decisions, not just decorate your dashboard.
Remember, SaaS success is not about moving fast—it is about moving in the right direction. And these metrics help you do exactly that.


