Imagine running a SaaS business without knowing what your users are doing. You launch new features, send campaigns, adjust prices, but you are not sure what works. That feels like flying blind, right?
This is where SaaS analytics steps in. It gives you the power to understand your customers, track your growth, and make smart decisions backed by real numbers. Whether you are a founder, product manager, or part of the marketing team, this guide is for you.
Let us break it all down in the simplest way possible.
What is SaaS Analytics?
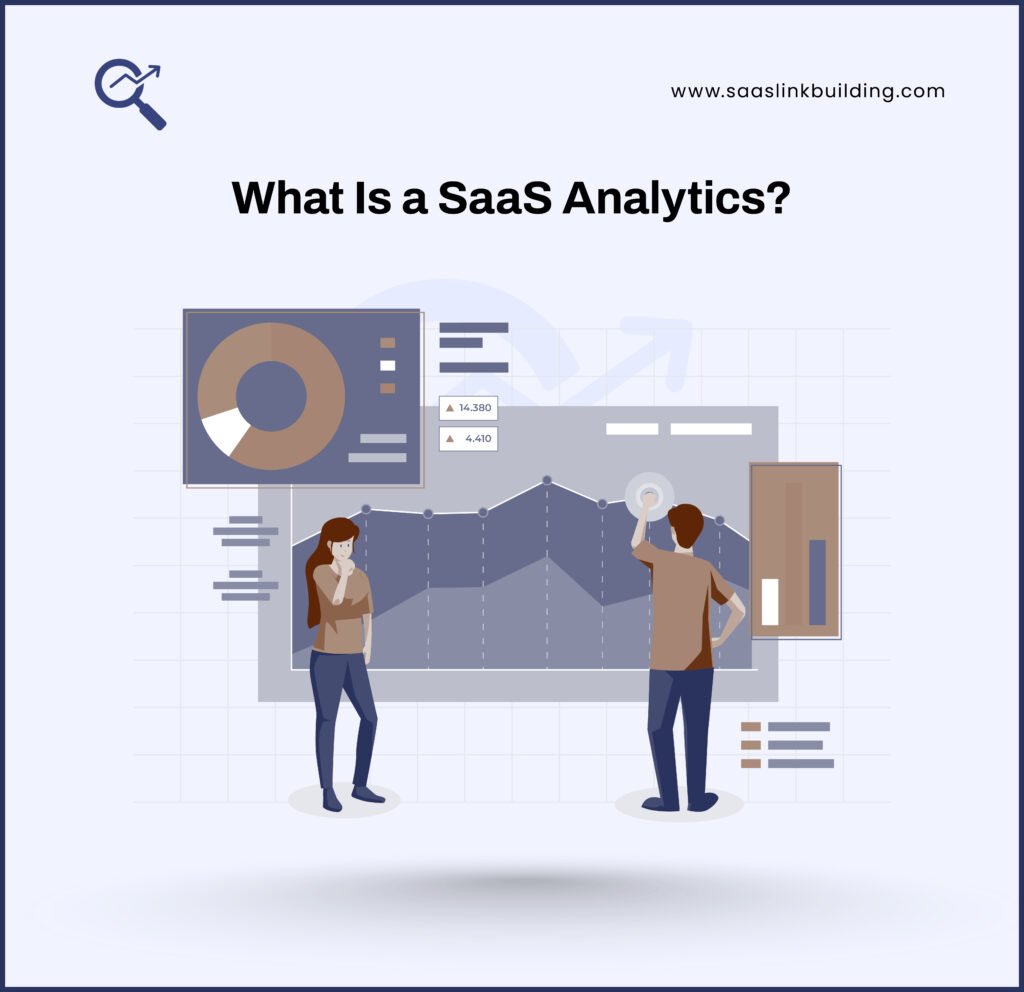
SaaS Analytics is the process of collecting, analyzing, and using data from a Software-as-a-Service (SaaS) product to make better business decisions. It helps SaaS companies track how users interact with their software, understand what is working or not, and identify ways to improve growth, revenue, and user satisfaction.
In Simple Words:
SaaS analytics tells you:
- Who is using your software
- How they are using it
- What features they like
- Where they are dropping off
- And what makes them stay or leave
Why SaaS Analytics Matters?
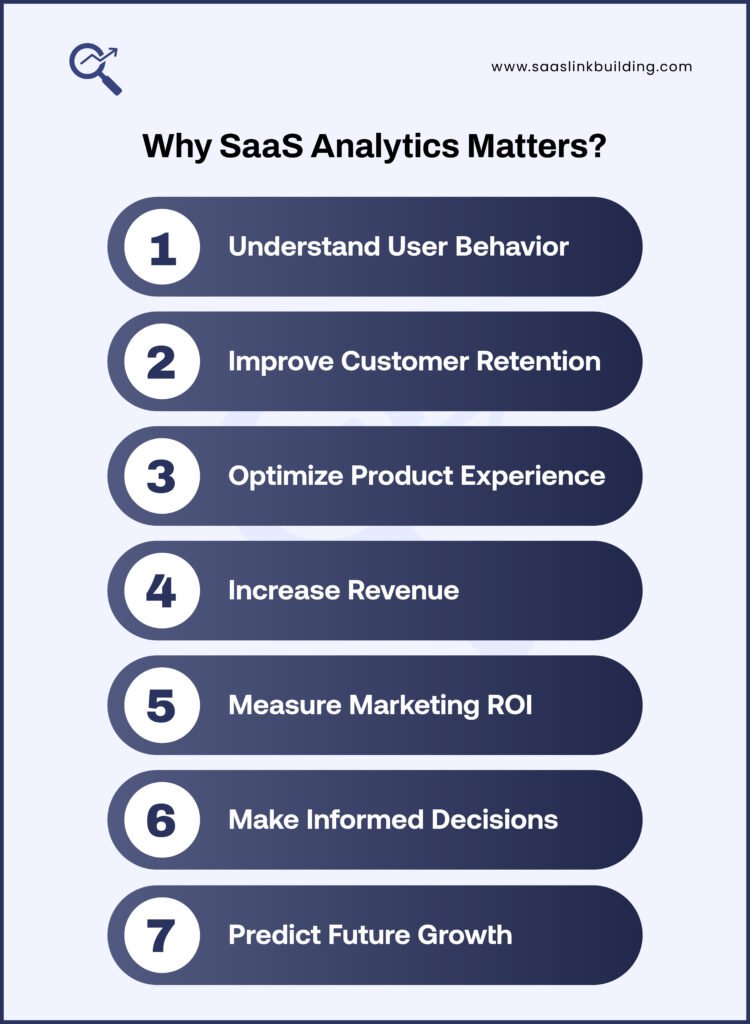
You might think you are doing okay without tracking every detail. But here is what analytics really helps you do:
1. Understand User Behavior
- See how users interact with your software.
- Know which features they use most.
- Find where they drop off or get stuck.
2. Improve Customer Retention
- Spot users who are about to churn.
- Set up alerts for declining engagement.
- Offer support before they leave.
3. Optimize Product Experience
- Use real-time feedback and usage data.
- Prioritize new features based on user needs.
- Remove or fix unused features.
4. Increase Revenue
- Track subscription trends (upgrades, downgrades, renewals).
- Discover your most profitable customer segments.
- Find the best upsell and cross-sell opportunities.
5. Measure Marketing ROI
- See which campaigns bring paying users.
- Understand which channels have the lowest CAC (Customer Acquisition Cost).
- Track lead-to-customer conversion rates.
6. Make Informed Decisions
- No more guesses or gut feelings.
- Use data to support product, sales, and marketing strategies.
- Stay ahead of competitors with real insights.
7. Predict Future Growth
- Spot trends early.
- Forecast MRR, churn, and user growth.
- Plan resources more effectively.
📊🚀 Want to go beyond just tracking data?
SaaS analytics is only one part of the growth puzzle. To truly unlock scale, you need a solid marketing foundation too. If you are ready to connect your insights with action — from content strategies to link building and more — check out our complete guide on SaaS Marketing. It covers everything you need to grow smarter, not harder.
Key SaaS Metrics You Should Track
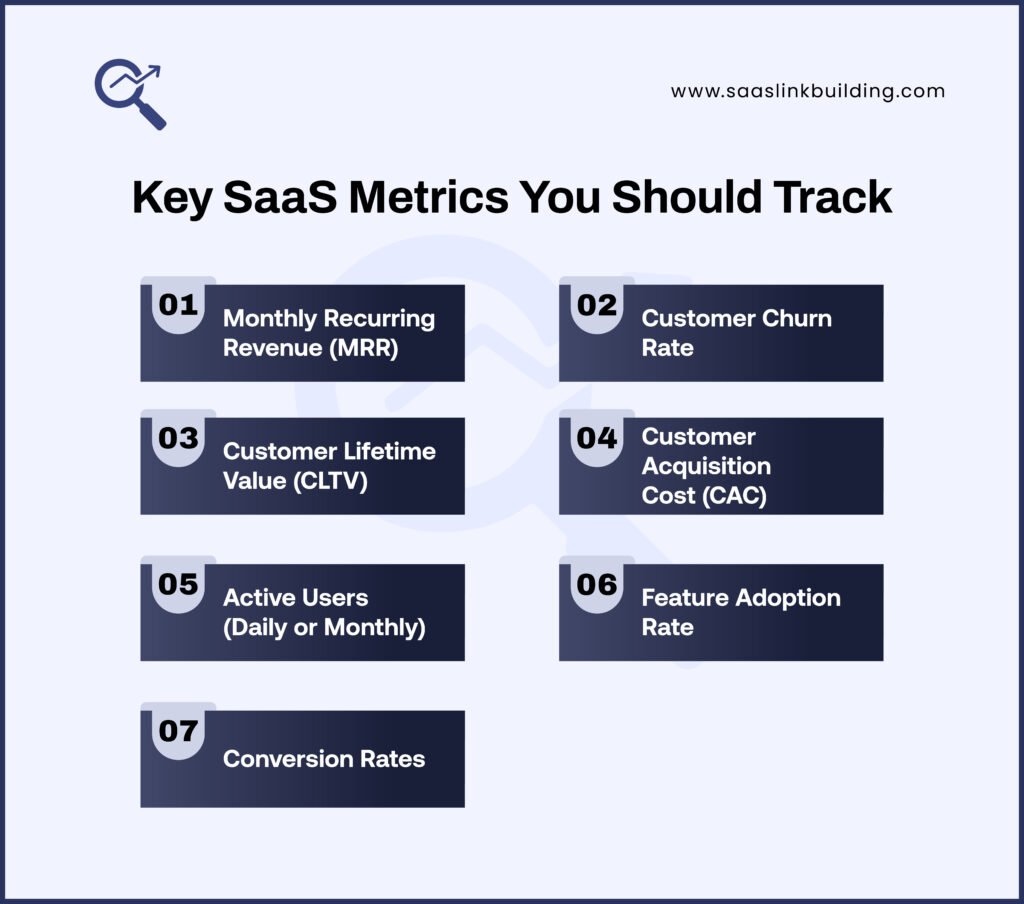
Here are some of the most important numbers to keep an eye on:
1. Monthly Recurring Revenue (MRR)
- The amount of money you make every month from subscriptions
- Helps you measure growth and plan expenses
2. Customer Churn Rate
- The percentage of users who stop using your product
- High churn means people are not happy
3. Customer Lifetime Value (CLTV)
- How much revenue a customer brings in during their time with you
- Helps you decide how much you can spend to get new users
4. Customer Acquisition Cost (CAC)
- How much you spend to get one new customer
- Should be lower than CLTV to be profitable
5. Active Users (Daily or Monthly)
- Shows how many users are actually using your product
6. Feature Adoption Rate
- Tells you if people are using the new tools you built
7. Conversion Rates
- From free trial to paid
- From visitor to signup
Best Tools to Collect SaaS Data
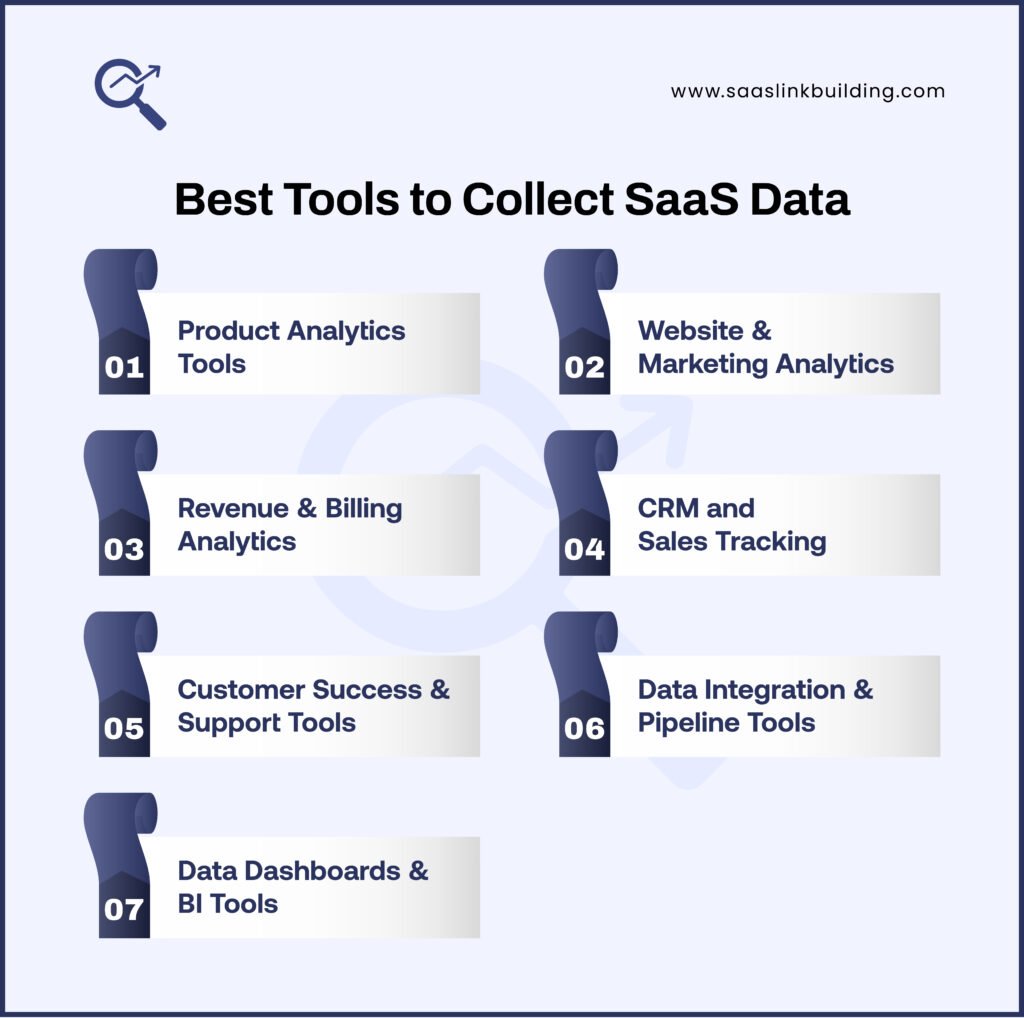
Here’s a simple and organized list of the best tools to collect SaaS data, broken down by category so you can choose what fits your needs:
1. Product Analytics Tools
These track how users interact inside your SaaS product.
- Mixpanel – Great for funnels, retention, and event tracking
- Amplitude – Powerful for behavioral analytics and cohorts
- Heap – Auto-tracks everything without manual setup
- Pendo – Also includes in-app guides and feedback
- PostHog – Open-source and self-hosted alternative
📌 Use these to learn what users click, which features they use, and where they drop off.
2. Website & Marketing Analytics
Track traffic, user behavior, and conversions on your website.
- Google Analytics 4 – Standard choice for tracking web traffic and goals
- Hotjar – Heatmaps, session recordings, and feedback polls
- Microsoft Clarity – Free tool for behavior tracking and heatmaps
- Crazy Egg – Scroll maps and click tracking
📌 Use these to understand how visitors become users.
3. Revenue & Billing Analytics
Understand your money: subscriptions, churn, MRR, and more.
- Stripe – Payments and subscriptions
- Baremetrics – Clean dashboards for MRR, LTV, CAC (connects with Stripe)
- ProfitWell – Free metrics and churn insights
- ChartMogul – Subscription analytics for SaaS revenue
- Chargebee – Billing plus revenue operations
📌 Use these to track how much revenue your SaaS is generating and from where.
4. CRM and Sales Tracking
Track customer interactions and deal flow.
- HubSpot – Easy CRM with email and sales automation
- Salesforce – Enterprise-level CRM with powerful customization
- Pipedrive – Simple pipeline-focused CRM
- Close – Built for SaaS and inside sales teams
📌 Use these to manage leads, conversions, and pipeline stages.
5. Customer Success & Support Tools
See how happy your users are and where they need help.
- Intercom – In-app chat, support, and onboarding
- Zendesk – Complete support ticket system
- Freshdesk – Similar to Zendesk, great for growing teams
- ChurnZero – Focused on retention and success metrics
- Gainsight – Enterprise-level customer success platform
📌 Use these to lower churn and improve customer happiness.
6. Data Integration & Pipeline Tools
Connect everything into one place.
- Segment – Collect and route data to analytics tools
- RudderStack – Open-source alternative to Segment
- Zapier – Simple no-code automation between tools
- Fivetran – Extract and load data into your data warehouse
- Airbyte – Open-source ETL tool for data syncing
📌 Use these to bring your data together and avoid silos.
7. Data Dashboards & BI Tools
Turn all that data into useful charts and insights.
- Looker Studio (formerly Google Data Studio) – Free and visual
- Tableau – Enterprise-level dashboard and reporting
- Power BI – Microsoft’s business analytics tool
- Metabase – Open-source, easy-to-use dashboards
- Mode Analytics – Great for SQL-based teams
📌 Use these to actually understand what the data means.
Setting Up Analytics Step-by-Step
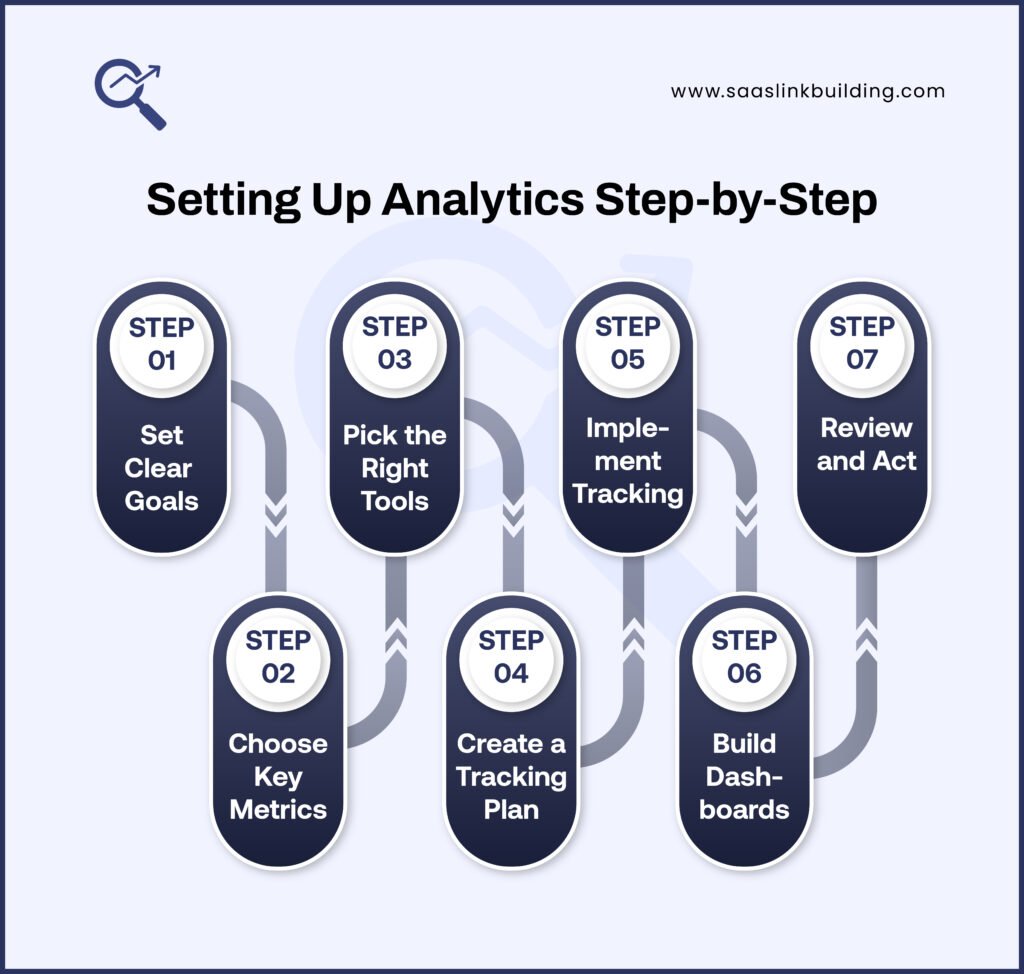
Here’s a simple step-by-step guide to setting up SaaS analytics — even if you are just starting out. Follow these steps to track the right data, choose the right tools, and make smart decisions with confidence.
Step 1: Set Clear Goals
Before you touch any tool, ask:
- What do you want to know?
- What problem are you solving?
Examples:
- I want to know why users drop off during onboarding.
- I want to track monthly revenue growth.
- I want to reduce churn.
💡 Your goals will decide what you need to track.
Step 2: Choose Key Metrics
Pick a few metrics based on your goals. Don’t track everything — just what matters.
Common SaaS metrics:
- MRR (Monthly Recurring Revenue)
- Churn Rate
- LTV (Customer Lifetime Value)
- CAC (Customer Acquisition Cost)
- Activation Rate
- Feature Usage
- Trial to Paid Conversion
💡 Keep it simple: fewer, meaningful metrics beat dozens of confusing ones.
Step 3: Pick the Right Tools
Now, choose tools for each type of data:
| Category | Tools |
| Product Analytics | Mixpanel, Amplitude, PostHog |
| Website Tracking | Google Analytics, Hotjar |
| CRM/Sales | HubSpot, Salesforce |
| Billing & Revenue | Stripe, Baremetrics, ProfitWell |
| Customer Support | Intercom, Zendesk |
| Data Integration | Segment, Zapier |
| Dashboards | Looker Studio, Metabase, Power BI |
💡 Pick only what you need now. You can always add more later.
Step 4: Create a Tracking Plan
This is your blueprint for what data you’ll track.
Include:
- What events to track (e.g., “Signed Up”, “Viewed Pricing”, “Completed Onboarding”)
- Where they happen (app, website, email, etc.)
- What properties to attach (e.g., plan type, device, time)
💡 Example:
Event: “Clicked Upgrade”
Properties: User Plan = Free, Device = Mobile
Step 5: Implement Tracking
Time to set things up.
- Add tracking code (from tools like Mixpanel or Segment) to your app and website
- Set up goals and events in Google Analytics
- Connect your billing platform (e.g., Stripe to Baremetrics)
- Sync your CRM with your support tools
💡 Work with your dev team or use no-code tools like Zapier where possible.
Step 6: Build Dashboards
Now you need to see your data.
Use tools like:
- Looker Studio for basic reports
- Mixpanel dashboards for user behavior
- Baremetrics for revenue snapshots
- Metabase for querying data with visuals
💡 Keep dashboards simple and focused on your goals.
Step 7: Review and Act
Set a weekly or monthly routine:
- Review key metrics
- Spot trends or issues
- Share insights with your team
- Decide what actions to take (e.g., fix onboarding steps, add in-app nudges, launch retention campaigns)
💡 Analytics without action is just noise. Always tie insights to next steps.
Using Data to Make Better Decisions
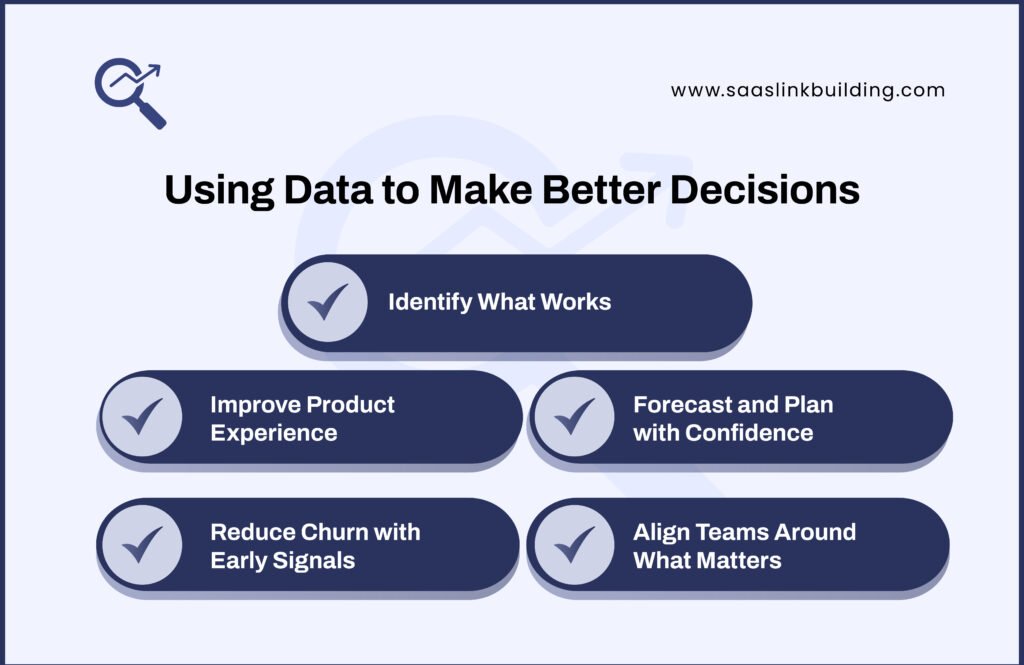
Once your SaaS analytics are up and running, the real magic happens — turning numbers into actions. Data is only useful if it leads to better decisions. Here is how you can actually use your data to grow smarter.
1. Identify What Works (and What Does Not)
Look at:
- Top-performing features — double down on what users love.
- Low engagement areas — either improve them or remove them.
- Best acquisition channels — invest more in channels with low CAC and high LTV.
2. Improve Product Experience
Use product usage data to:
- Spot drop-offs in onboarding
- Add tooltips where users get stuck
- Personalize the journey based on behavior
Example: If 70% of users drop off before completing setup, try reducing steps or adding guidance.
3. Reduce Churn with Early Signals
Track:
- Daily/weekly active users
- Support ticket trends
- Decline in feature usage
If usage drops, set up alerts and reach out before users churn. Add education, offers, or support to win them back.
4. Forecast and Plan with Confidence
Use data to:
- Predict revenue with MRR trends
- Spot when to scale servers or support
- Estimate hiring needs based on active users
5. Align Teams Around What Matters
When your whole team has access to clean, clear dashboards:
- Marketing knows which campaigns convert best
- Product knows what to build next
- Sales knows who is ready to buy
No more guessing. Just decisions backed by real behavior.
Real-World SaaS Analytics Examples
Let us look at some simple but powerful use cases:
Case 1: Improving Onboarding
A company noticed new users were not finishing setup. They checked where users dropped off and simplified that step. Result? Higher activation rates.
Case 2: Reducing Churn
A support tool found that users who did not use a certain feature left within a month. They added tutorials and reminders for that feature. Churn dropped by 15 percent.
Case 3: Boosting Conversions
An email SaaS tested two different headlines for their signup page. One outperformed the other by 30 percent. A small change made a big difference.
SaaS Analytics Best Practices
Tracking data is just the beginning. To actually grow your SaaS business, you need to use that data the right way. These best practices will help you stay focused, clean, and actionable with your analytics setup.
1. Focus on Actionable Metrics
- Don’t fall into the trap of vanity metrics (like pageviews or total users).
- Track what truly drives growth — activation, retention, churn, MRR, and LTV.
- Always ask: “What decision can I make with this number?”
2. Keep Your Data Clean
- Set a naming convention for events and properties.
- Avoid duplicate or unclear events like signup, sign_up, userSignup.
- Clean data = clear insights.
3. Always Test Before Trusting
- Double-check if your events are firing correctly.
- Use test accounts to simulate user behavior before going live.
- Use tools like Segment’s debugger or Mixpanel’s live view.
4. Track Behavior Over Time
- Don’t just look at data snapshots.
- Follow trends: How has feature usage changed over the past 30 days? Are activation rates improving?
Time-based tracking gives you context, not just numbers.
5. Review Regularly and Iterate
- Schedule weekly or monthly analytics reviews.
- Involve your team — product, marketing, support.
- Update your tracking plan as your product evolves.
6. Democratize Access to Data
- Make dashboards available to the whole team.
- Help non-technical teammates understand the metrics that matter to them.
- More eyes = better decisions.
7. Respect User Privacy
- Be transparent about data collection.
- Comply with GDPR, CCPA, and other laws.
- Anonymize personal data where possible and avoid overtracking.
Common Mistakes to Avoid
Even smart teams mess up sometimes. Here is what to avoid:
- Focusing only on vanity metrics (like social likes or traffic with no signups)
- Setting too many KPIs (which can lead to confusion)
- Not acting on data (collecting it means nothing if you do not use it)
- Ignoring the context (a sudden spike could be seasonal or due to a bug)
- Blindly copying competitors (what works for them may not work for you)
Building a Data-Driven Culture
Having analytics is great. But getting everyone to care about it is better.
Here is how to build a team that loves data:
- Talk about data in meetings
- Celebrate small wins based on metrics
- Train team members to read reports
- Create a dashboard everyone can see
- Encourage questions and curiosity
Data should not be scary. Make it a part of daily work.
Future of SaaS Analytics
Things are changing fast. Here are a few trends to watch:
- AI and machine learning: Tools that predict churn before it happens
- No-code dashboards: Easier reporting without needing engineers
- Privacy-first tracking: Respecting user data while learning from it
- Real-time analytics: Instant updates instead of waiting a day or two
The goal is to get smarter, faster, and more ethical with how we use data.
Final Thoughts
You do not need to be a data expert to win at SaaS analytics. Start small, focus on what matters, and build from there. The key is to stay curious, keep testing, and always use your numbers to guide decisions.
When done right, analytics helps you grow with confidence. It is like having a map in a journey that is full of twists and turns.
Keep learning, keep tracking, and keep improving.


